.NET
·
windbg a .net core 3.1 app memory leak
I've spent the past few days trying to fix a memory leak. I was having problems to figure out what was leaking, so I used windbg wishing that it would help me.
I confess that I'm not an experienced user of windbg, so I google how to catch memory issues using windbg. There's a ton of information out there. The problem is that I didn't found a guide on how to do it with a .net core application.
So, I'm sharing here how I've done it:
- Install windbg (see here).
- Add windbg.exe (x64 version) to your environment path.
- Install SOS (see here):
dotnet tool install -g dotnet-sos. - Set breakpoint(s) using
System.Diagnostics.Debugger.Break()in your source code. - Update your project (*.csproj file) to Load Symbols:
<DebugSymbols>true</DebugSymbols><DebugType>pdbonly</DebugType>. - Build your project using Release configuration:
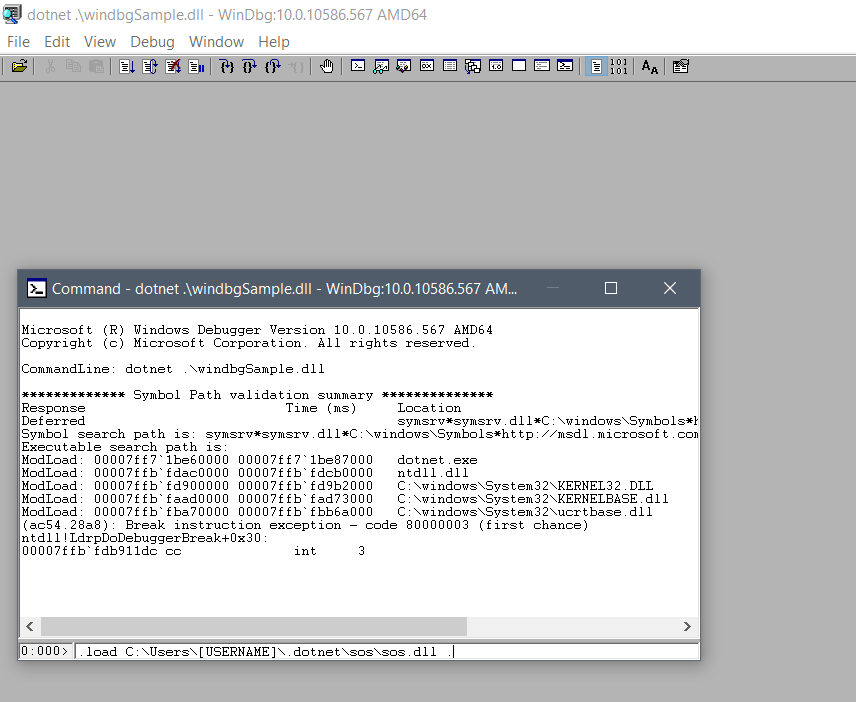
dotnet build -c Release. - Launch with WinDbg attached to your project:
windbg dotnet [YOUR DLL PATH].dll. - Load SOS using
.load C:\Users\[USERNAME]\.dotnet\sos\sos.dll ..
- Enter
gto go to the first breakpoint. - Enter
!gchandlesto see garbage collector handles. !DumpHeap /d -mt [MT]using the memory type id from the result list of the previous command. Example:!DumpHeap /d -mt 00007ffb4c85ca98!gcroot -all [ADDRESS]using the memory address form the result list of the previous command. Example:!gcroot -all 0x0000023cd2e71510
Following this guide, you should have a clue of what is still in memory and where the object is in use.
Hope this helps.